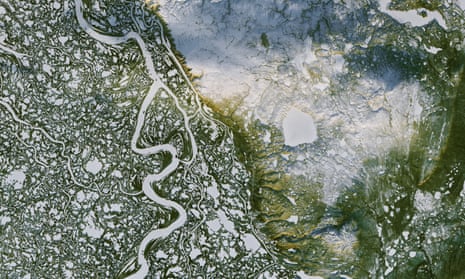
The Mackenzie river system is Canada’s largest watershed, and the 10th largest water basin in the world. The river runs 4,200km (2,600 miles) from the Columbia icefield in the Canadian Rockies to the Arctic Ocean. If your vehicle weighs less than 22,000lb, you can drive the frozen river out to Reindeer Station. The bitterly cold ice road runs for 194km between the remote outposts of Inuvik and Tuktoyaktuk. White, snow- and ice-covered waterways of the east channel of the Mackenzie river delta stand out amid green, pine-covered land. The low angle of the sunlight bathes the higher elevations in golden light. The pond- and lake-covered lands around the river are home to caribou, waterfowl, and a number of fish species. Several thousand reindeer travel through this area each year on the way to their calving grounds.
Cambodia’s forests are rapidly being cleared. Among countries with accelerated rates of deforestation – Sierra Leone, Madagascar, Uruguay, and Paraguay among them – Cambodia ranks above them all with an annual loss of 14.4% of its forests between 2001 and 2014, according to researchers at the University of Maryland. In that time period, Cambodia lost 5,560 sq miles of forests. The image captured in 1999 shows vast dark green forest among a mountainous area of Cambodia. The 2017 image reveals areas where forest has been clear-cut: the bright green landscapes in the lower left interspersed with darker blocks are crops; the pinkish-tan areas are old, small-plot agricultural areas, and the bright green rectangles (top left) are agroforestry areas where rubber or oil palm plantations have emerged. Researchers have demonstrated that changes in global rubber prices and a surge in land-concession deals have helped accelerate Cambodia’s rate of deforestation. The Cambodian government leases concession lands to domestic and foreign investors for agriculture, timber production, and other uses.
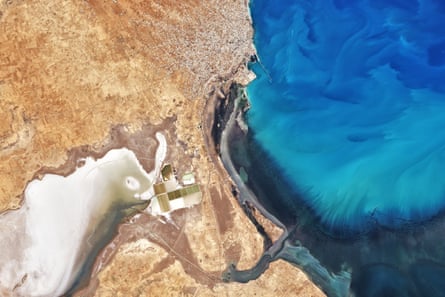
A close view of the sea about 15km south of the coastal city of Zarzis appears to show a phytoplankton bloom off the coast of Tunisia. It is also possible that the discoloration is from sediment. Upwelling of deeper, nutrient-rich waters can cause such blooms, which provide marine life with a source of food. Other times they are fueled by nutrient runoff from rivers and coastal waterways. Most blooms are benign, but some can become harmful when they consume too much of the oxygen in the water or when the phytoplankton species are toxic. Overfishing and phosphate pollution from industry have led to lower fish catches off Tunisia’s coast in recent years, according to recent studies. An increase in inorganic compounds (found in fertilisers) have been linked to sporadic blooms in the Gulf of Gabès. In addition, warmer than average water temperatures and lower wind speeds in the area occasionally create ripe conditions for phytoplankton growth.
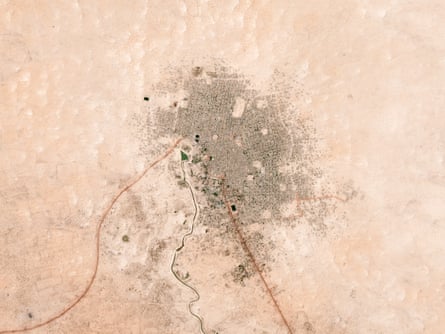
Timbuktu lies at the gateway to the Sahara – between the fertile zones of Mali’s Niger river. This Unesco world heritage site with three mosques and 16 mausoleums dates back to a period of Islamic expansion in the 15th and 16th centuries.
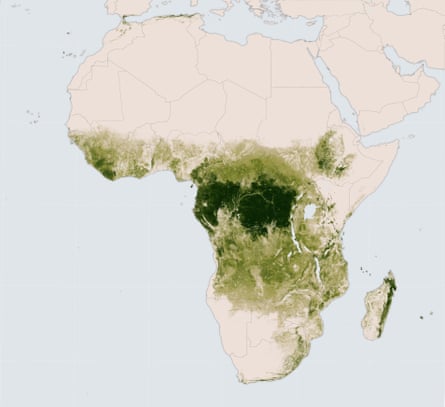
In Rwanda’s Nyungwe forest national park the trees grow tall. Old hardwood trees – such as mahogany and ebony – tower over the forest floor. But just beyond the park borders, the vegetation is markedly less robust. Along the equator in Africa, dense rainforests are the “green heart” of an otherwise dry continent.
Yet in some places human activity has cut into this verdant core – a fact that can be derived from measurements of tree height. In a November 2016 paper published in Remote Sensing of Environment, researchers described how they created a continent-scale view of African forests by cross-referencing data from computer models and several satellites.
The map, derived from that analysis, depicts areas with tall canopies (in the image the darkest green areas represent the tallest trees, of 20m and above, with the shade getting lighter for smaller trees) – particularly the thick band of tropical rainforest across equatorial Africa – as well as areas with little or no tall growth (tan-colored areas). The new analysis gives forest ecologists a more accurate picture of a landscape undergoing frequent change, especially from smallholder agriculture.
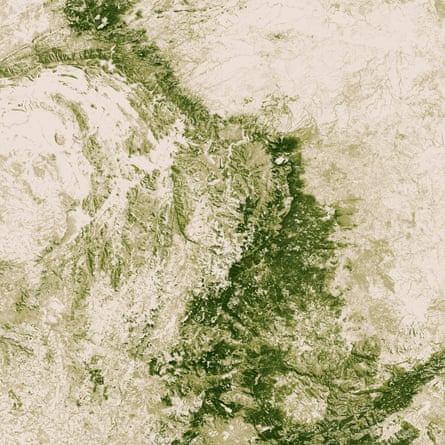
Africa’s Great Escarpment is a place of big ups and downs. Parallel ridges and deep, long valleys create a range of habitats and elevations for flora and fauna. But the Escarpment sees ups and downs in another sense: tree height varies significantly here – as before, in this image the darker the green, the higher the trees, with the darkest green areas representing trees at 20m or above and the tan areas having no tree cover.
Scientists can analyze land use in these images to identify areas with deforestation. But elsewhere, plantations have brought tree growth to former grasslands, stimulating economic growth but pushing out native wildlife. The Great Escarpment is one such place. The ridge, which separates a highland plateau from low-lying coastal areas, extends thousands of kilometers across several countries in southern Africa. Much of its eastern flank, now greatly fragmented, was once carpeted in peat moss and grass which filtered water flowing to ecosystems downstream. Now timber has replaced much of this low-lying vegetation.
This section of the Great Escarpment is located in South Africa’s Mpumalanga province, near the town of Sabie. The trees are likely eucalyptus or pine, both of which supply timber for export.
But more trees do not spell good news for grassland ecosystems, according to Ralph Clark, a researcher at the Great Escarpment biodiversity programme of Rhodes University. “Tree cover increase in this area is actually environmentally devastating to biodiversity and water supplies,” Clark said. Plantations consume a lot of water; they can also lead to extinction of local species, he said. “Don’t confuse mitigating deforestation elsewhere with afforestation in this context – it’s the same as putting a bulldozer through a rainforest in terms of species impacts.”
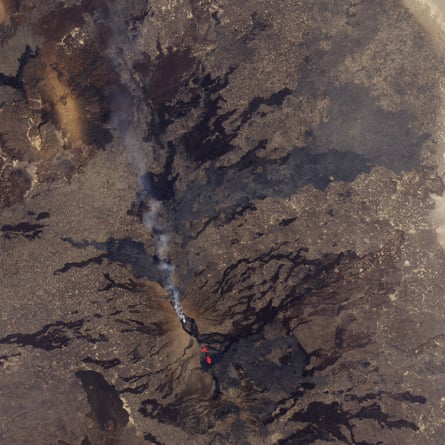
In Africa’s Danakil depression three tectonic plates are tearing themselves apart in spectacular fashion. As the plates separate, several active volcanoes have emerged along the seams. One of the most active is a shield volcano near the Ethiopian and Eritrean border. It is known as the “smoking mountain” and the “gateway to hell” in the Afar language. Erta Ale has a long-lived lava lake that has gurgled and spattered in its caldera for decades, but the most recent bout of activity involves the south-east flank of the gently sloping mountain. According to reports posted by Volcano Discovery, new fissures opened up on 21 January about 7km from the summit caldera, spilling large amounts of lava. Plumes of volcanic gases and steam drift from the lava lakes.
In 1960, about 110 million Chinese people – or 16% of the population – lived in cities. By 2015, that number had swollen to 760 million and 56%. (For comparison, the population of the US was about 325 million people as of March 2017.)
The unprecedented surge in urbanisation began in the 1980s when the Chinese government began opening the country to foreign trade and investment. As markets developed in “special economic zones”, villages morphed into booming cities and cities grew into sprawling megalopolises.
Perhaps no city epitomises the trend better than Shanghai. What had been a relatively compact industrial city of 12 million people in 1982 had swollen to 24 million in 2016, making it one of the largest metropolitan areas in the world.
The composite images above show how cities in the Yangtze river delta have expanded since 1984. Note how Suzhou and Wuxi have merged with Shanghai to create one continuous megalopolis.
New Zealand’s Tasman glacier is the longest glacier in the country but is neither immovable nor permanent. Instead, it continues to shrink by the day. In the first image, captured on 30 December 1990, the Tasman glacier stretched like a serpentine tongue. The second image was taken on 29 January 2017. Both false-colour images use white to show frozen snow or ice, and blue for water. Brown represents bare ground, while red areas are covered in vegetation. In the 27 years between the two images, the ice has retreated an average of 180 metres per year, according to New Zealand’s National Institute of Water and Atmospheric Research. Before 1973, Tasman Lake did not exist. In the past decade, it has swollen to 7km long. The lake growth is a direct result of the glacier’s decline. Tasman glacier retreated 4.5km from 1990 to 2015 mostly through calving, according to Mauri Pelto, a glaciologist at Nichols College.
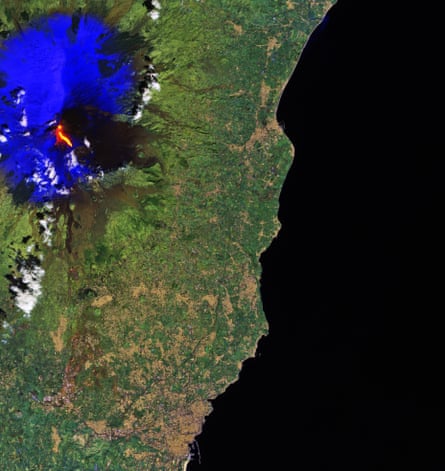
Lava flows from Mount Etna in Sicily, Italy, the largest active volcano in Europe with one of the world’s longest records for continuous eruption. On 16 March, however, there was a sudden explosion resulting in several people being injured. The surrounding snow has been processed in blue to distinguish from the clouds.
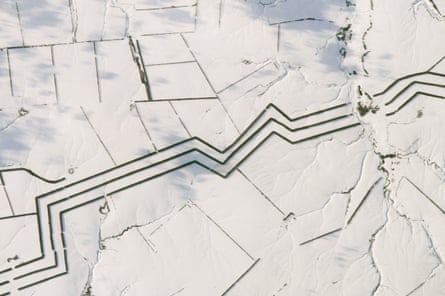
The dark, angular lines crossing this snowy landscape are a major shelterbelt – also known as a windbreak – crossing the steppes of southern Russia near the Volga river (Volgograd Oblast). The image shows a 14km section of an extensive system of shelterbelts planted to protect crops and reduce the erosion of steppe soils by wind. The shelterbelt is broken where it meets a local stream. Each of the north-south trending lines is a dense mass of trees about 60 metres wide. The trees throw shadows to the east in this late afternoon view (north is to the right). Together the three lines span about 800 metres (900 yards), and there is enough space between the rows of trees for narrow fields to be tilled. Shelterbelt construction began when open steppe landscapes were first settled by Russian famers in the early 1700s. At present, more than 2m hectares of the steppes have been planted. The soils within the main shelterbelts in this region have been shown to be significantly improved, becoming richer in organic carbon than virgin soils that have never been plowed. Narrower lines of trees along farm boundaries are also evident; these protect individual fields from winds and associated gully erosion. The trees also protect water bodies from evaporation by the steady winds, and prevent ponds and streams from filling with blown sand and silt.
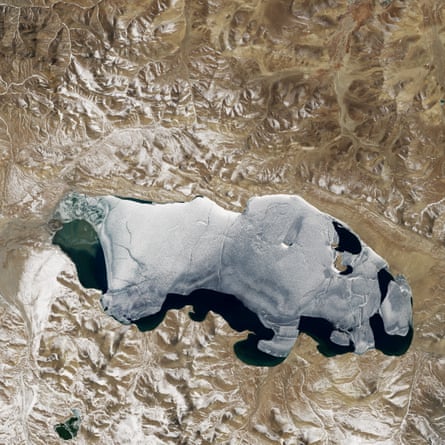
Several hundred lakes dot the expansive Tibetan plateau. With the average plateau elevation exceeding 4,500 metres above sea level, its lakes are among the highest in the world. Puma Yumco in Lhozhag county is one of the larger lakes in southern Tibet. A small village along the eastern edge of the lake – Tuiwa – is reportedly one of the highest administered settlements in the world, sitting at an elevation of 5,070 metres. Tuiwa’s economy centres on raising livestock (sheep and yaks), tourism, and textiles. Though there are fish in the lake, they are considered sacred and are not eaten by most Tibetans. Every winter, villagers herd thousands of sheep across the lake’s frozen surface to two small islands where the soil is more fertile and the forage is better in the winter. While the rhythms of life have remained largely unchanged in Tuiwa for many decades, researchers have used satellites to track subtle changes at Puma Yumco and other lakes throughout the plateau. One team has found that the number of lakes on the Tibetan Plateau has increased by 48%, and the surface area of the water has increased by 27% between the 1990s and 2015.
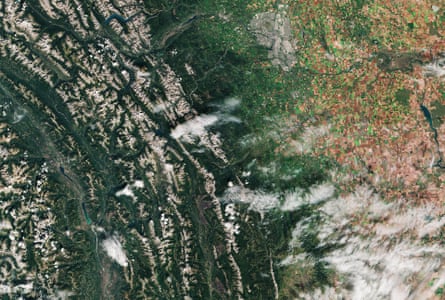
From the Rocky Mountains on the left (west) to the prairies on the right (east), the image shows the southern part of the Canadian province of Alberta, with part of British Columbia in the lower left. The city of Calgary lies in the transition zone between the two landscapes (upper-middle). This area has naturally occurring “chernozem” – black soil – and is part of one of two chernozem belts in the world – the other stretching across part of eastern Europe and Russia. This fertile soil produces a high agricultural yield, evident by the numerous fields on the right side of the image. A section of the Trans-Canada highway is also evident, entering Calgary in a direct line from the east, and then snaking into the Rockies towards the west. In the upper left we can see the long, curved glacial Lake Minnewanka. Fed mainly by the Cascade river, a dam built in the 1940s raised the lake by about 30 metres and submerged a resort village, as well as the previous dam built in 1912. Today, it is a popular destination for scuba divers to explore the underwater dam.
Several oil fires that have burned in northern Iraq for months have been extinguished. Nasa satellites first detected fires at one or two wells near the towns of Qayyarah and Shargat in May 2016. Small fires continued to spring up intermittently throughout June. In July 2016, the number and volume of fires increased dramatically. From July 2016 onward, satellites returned daily images showing clouds of thick, black smoke streaming from the Qayyarah oil field. For a period in October, black smoke from oil fires even mixed with a noxious white cloud of sulfur dioxide from a separate blaze at a factory. By April 2017, Iraqi firefighters had put out the fires. Iraq’s oil ministry made a formal announcement about the end of the fires on 4 April 2017. Of the 50 oil wells in the area, militants lit 18 of them, according to Rudaw.
Heavy rains that began in mid-March left Peru reeling. More than 70,000 people lost their homes, according to Reuters, and more than 80 people died in mudslides and flooding. The false-color image form 2017 shows the Lago La Niña (in deep blue) and Piura River swollen far past their banks. Cloud cover appears light blue. The 2016 image shows the same area about one year earlier, with coastal salt pans appearing light blue. Multiple storms hit Peru’s north coast between 19 and 23 March 2017, bringing heavy rain and lightning. A lot of critical infrastructure did not survive the floods intact; more than 500 bridges were damaged and nearly 100 collapsed.
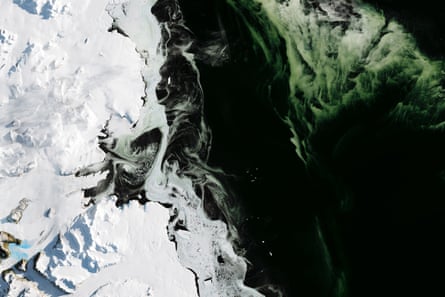
It may look like someone dyed the water green but the emerald hue visible off the coast of Antarctica is entirely natural. These images show water, sea ice, and phytoplankton in Antarctica’s Granite Harbor – a cove in the vicinity of the Ross Sea. Jan Lieser, a marine glaciologist from Australia’s Antarctic Climate and Ecosystems Cooperative Research Center thinks the green color is caused by phytoplankton at the water’s surface that have discolored the sea ice.
These microscopic marine plants, also called microalgae, typically flourish in the waters around Antarctica in the austral spring and summer, when the edge of the sea ice recedes and there is ample sunlight. But scientists have noticed that given the right conditions, they can grow in autumn too. Sea ice, winds, sunlight, nutrient availability, and predators all factor into whether plankton can grow in large enough quantities to color the slush-ice and make it visible from space.
Scientists know that phytoplankton are important for the ecology of the Southern Ocean, as they are an abundant food source for zooplankton, fish, and other marine species. But researchers still have many questions about their presence around Antarctica in the fall. Lieser wonders: “Do these kinds of late-season ‘blooms’ provide the seeding conditions for the next spring’s bloom? If the algae get incorporated into the sea ice and remain more or less dormant during the winter, where do they end up after the winter?” Scientists might get some answers from an expedition scheduled to visit the area in April.
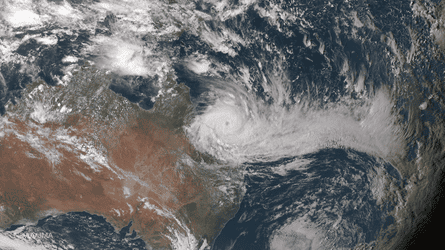
Tropical cyclone Debbie closes in on the north-eastern coast of Australia on 27 March. The Joint Typhoon Warning Center located the cyclone approximately 295 nautical miles east-southeast of Cairns, Australia, moving at a speed of about five mph. The storm had maximum sustained winds of about 100 mph with gusts of 125 mph.

At the north-eastern tip of Ellesmere Island (lower-left), the Nares Strait opens up into the Lincoln Sea in the Canadian Arctic. The image was created by combining three radar scans from Copernicus Sentinel-1 captured in December, January and February. Each image has been assigned a colour – red, green and blue – to illustrate changes between acquisitions, such as the movement of ice in the Lincoln Sea, while the static landmass is grey. The obvious distinction between the red and yellow depicts how the ice cover has changed over the three months. The maximum extent of Arctic sea ice hit a record low this winter. Scientists attribute the reduced ice cover to a very warm autumn and winter, exacerbated by a number of extreme winter ‘heatwaves’ over the Arctic Ocean.
In the centre-left on the land, we can see a straight, dark link with a circle at its left end. This is the runway for Alert – the northernmost known settlement in the world. Inhabited mainly by military and scientific personnel on rotation, Alert is about 800km from the North Pole. A team of researchers on the CryoVex/Karen campaign was recently in Alert validating sea-ice thickness measurements from the CryoSat satellite and testing future satellite mission concepts. Taking off from Alert, the team flew two aircraft equipped with instruments that measure sea-ice thickness at the same time as the satellite flew some 700km overhead. The measurements from the airborne campaign will be compared to the satellite measurements in order to confirm the satellite’s accuracy.
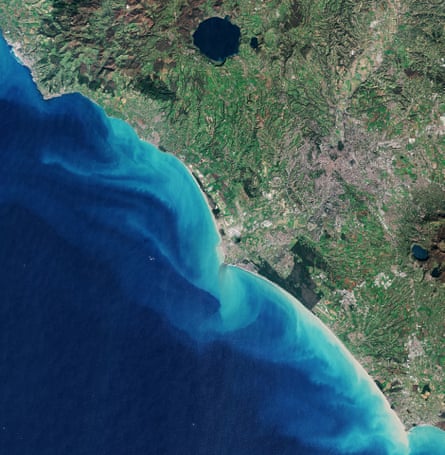
Rome and its surroundings. The Tiber River snakes down from the north, and is surrounded by agricultural fields in the upper right before entering the city. It then makes its way west, entering into the Mediterranean Sea at the town of Ostia. Near its terminus, we can see the runways of the Fiumicino Airport. Long, sandy beaches are visible along the coastline, with the port of Civitavecchia visible in the upper left. This is a major point of ferry connection to many Mediterranean islands, such as Sardinia and Sicily. The lakes visible are Bracciano near the top of the image, with the smaller Martignano nearby. Near the lower right, we see lakes Albano and Nemi in the so-called ‘Castelli Romani’ – a group of small cities in the Alban Hills.
When one of the world’s ships reaches the end of its useful life, it often ends up on one of three beaches in south-east Asia – Alang in India; Gadani in Pakistan, or Chittagong in Bangladesh. The ships are grounded at high tide, then slowly disassembled with blowtorches and crowbars. Steel recovered from the ships’ hulls helps feed the construction industry in these developing economies. These pictures are part of a series showing Alang Beach on various dates in March. They show old ships vanishing, new ships arriving, and the pace of deconstruction. They may help verify estimates of the amount of steel these activities provide to the local economy.
